
The Focus Score offers a quick overview of how well skill execution went for a workout. TritonWear's AI analyzes 30 metrics for every lap, removes the outlier data (drills, equipment work, etc), and generates simple digestible numbers you can use to improve. A score of 75 or higher means skill execution today was as good or slightly better than usual.
Usual, in this case, refers to all activities over the past 30 - 260 days, depending on how training is tracked. For a user who tracks only test sets, the window will be closer to 260 days and take much longer to reflect changes in skill execution. For a swimmer who consistently tracks training 6+ times a week, the window will be closer to 30 days, and the scores will be much more responsive to skill acquisition changes.
Throughout the season, when there is more emphasis on distance than speed, metrics will reflect this. Conversely, as training shifts into faster cycles, metrics will shift as well. As these cyclical changes occur, you may notice Focus scores becoming slightly erratic as they adjust to the different training styles.
Peeling back the Focus Score layers:
The top-level Score reflects the whole workout, all metrics across all core swimming laps.
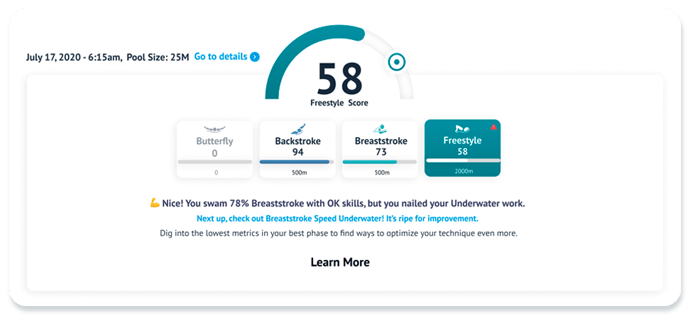
One layer deeper than the Focus score, is the Stroke Scores. Each stroke type swam during a workout will receive a score. The distance of that stroke in the workout is also reflected so users can focus in on the core metrics of main strokes, rather than rest or easy strokes. However, if rest or easy strokes always show low scores, there is an opportunity for improvement. As even when the swimming is easy, skill execution should still be top of mind.


Another layer of scores deeper into Focus is the Phase Scores. TritonWear's 30 metrics are divided into three phases: Overwater, Underwater, and Transitions.

And the final layer is the Metrics Scores. Each metric gets a score for each workout.
Tap on any metric card to explore the following:
- the card will flip over to reveal the metric's Today, Average and Like Me values. Use these to see how well swimming went today, and how the average compares to the like me to determine if this should be something to set a SMART goal around.
- The metric statement will update to indicate how today went compared to usual (my averages) or how usual compares to your comparison group (like me)
- The Over Time graph below will plot all data points within the displayed timeframe of the same pool length

The default view at the phase and metric level is to compare your skill execution today against "My Average" (how you usually swim). However, you can switch the toggle to compare to swimmers "Like Me" which will give you a new set of scores. Like me compares your skill execution usually to that of swimmers who resemble your competing gender, height, and speed profile.
How will this help you to improve?
Knowing where to spend your time in training is the fastest way to improve. If you don't know where to focus, you train all skills, but never really hit the quick wins. But analyzing 30 metrics for every single lap quickly becomes information overload, which is a real challenge. Focus pinpoints the skills holding you back, so you can focus on the right areas to improve.
If the intention of a given workout is to improve turns, check how the transition metrics compare to your average. Then use "Like Me" to find out which transition elements are holding you back, so you can optimize the specific areas that will help you overtake the competition.
The individual scores for stroke types and specific metrics will also help you identify your progress and plateaus and allow you to adjust your training to continue improving (and see that reflected in the rising score).