
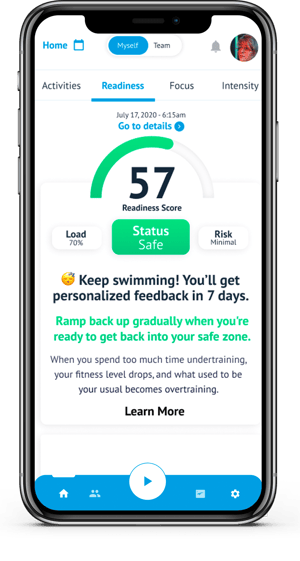
Your Readiness Score tells you how well you are priming athletes to perform
Readiness Score is an overview of how well Optimal Training Load (volume + intensity) is maintained. TritonWear uses AI to learn each swimmer's training trends and established sports science measures to calculate how ready an athlete is for more or harder training, to remain primed to perform.
Scores above 90 mean training load is increasing or decreasing at a good pace, and the closer it gets to 100 the better training load is being maximized while keeping the athlete within their "Safe Zone."
Scores under 90 are caused by over OR under training and mean the athlete's body cannot adjust to the speed with which the load on their body changes.
Below your readiness score you will find the 3 elements of Readiness:
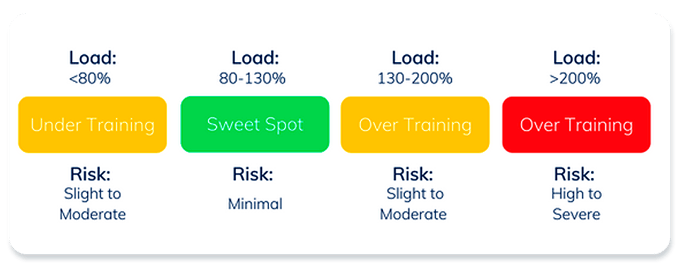
- Load reflects how quickly training is changing. It is measured as a percentage comparing the last 7 days to the last 28. The sweet spot is 115%, with anything between 80 - 130% being in the safe zone
- When in a period of increasing volume and/or intensity, aim for between 105-130%. This indicates load is increasing as quickly as possible while ensuring the athlete's body can safely adjust
- When in a period of decreasing volume or intensity, such as during taper, keep this number between 80 - 105%. with 80 being the fastest load can safely decrease while giving the athlete's body room to adjust to the change. If you have a longer taper, stay closer to 105, if you need to taper quickly, stay closer to 88
- Status indicates how close the athlete is to their safe zone
- 'Under' indicates that not enough load is being incurred. 'Over' means activities in the past 7 days have resulted in too much load. The colour visually indicate how far over or under you are:
- Green: in the speed spot, training with a load between 80 - 130% and risk is minimal
- Yellow: training load is well above or below the sweet spot; risk is slight to moderate
- Red: training load is very high, increasing much too quickly for the swimmer's body to adjust effectively. risk is high to severe
- 'Under' indicates that not enough load is being incurred. 'Over' means activities in the past 7 days have resulted in too much load. The colour visually indicate how far over or under you are:
- Risk highlights how much more likely an injury is at the current training load level.
| 0 - 50% | Moderate |
| 50 - 80% | Moderate |
| 80-130% | Minimal |
| 130 - 150% | Slight |
| 150-200% | Moderate |
| 200-300% | High |
| 300%+ | Severe |
To keep Readiness as accurate as possible, enter Workout Rating for every workout, and log all out of pool exercise as manual workouts.
No matter what part of the season you are in (increasing or tapering), Readiness should remain constant if you are safely loading and unloading volume and intensity at a steady rate.
How will this help you improve?
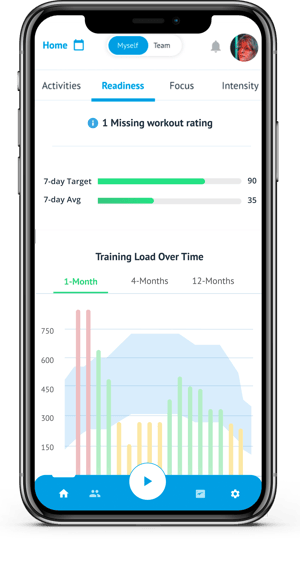
This simple number can help you adjust your future training plans to make sure you can keep pushing yourself and improving while staying in the Safe Zone with less injury risk. TritonWear will give you specific recommendations, and also you can learn to read and interpret your Training Load Over Time Graph and your Readiness Over Time graph.
After all, your health and fitness are the most important factor to your success.