
Coaches don't have time to dig into each swimmer's data individually, so Diagnostic is here to help pinpoint the right skills to work on across an entire team.
Diagnostic is similar to Focus Like Me but for the whole team. It looks at how a team stacks up against all other teams in our database at the stroke, swim phase and metric level. We even give you a level badge so you can celebrate together each time you level up!
How to Access Team Diagnostics
Diagnostics can be accessed differently based on the device you're using:
- iPad or Computer: On the Analysis page above the season graph, you'll see a "Run Diagnostic" button. Just tap or click to generate the team diagnostic report.
- Phone: On the Analysis page, switch to the Diagnostics tab, where your team report will be readily available.
Your first Diagnostic will be available 28 days after your first workout, as we do not want you to make decisions on data too early.
If 28 days pass without a single workout recorded for any team member, Diagnostic will return to a locked state. But don't worry; once someone swims within 90 days, it'll unlock on their next workout.
As with all TritonWear features, you can stay high level or dive down to the deepest details using the three sections of Diagnostic:
- Team Summary - stay high level with stroke and phase scores
- Top Strengths and Weaknesses - dig into your best/worst for each stroke and phase
- All Metrics change over time - dive deep into all the metrics with a change comparison
⏱️Diagnostics is available only to coaches and admins, not swimmers.
Team Summary
In the team summary section, you'll see how many athletes are included in your diagnostic, as well as:
- Level badge
- Stroke strength breakdown
- Phase strength breakdown
🤓You can also tap the athlete count to see exactly who’s included in the report. This gives you full visibility into which swimmers are contributing to the team’s scores so you can plan with confidence.

All swimmers with at least one workout in the last 28 days are included in the analysis.
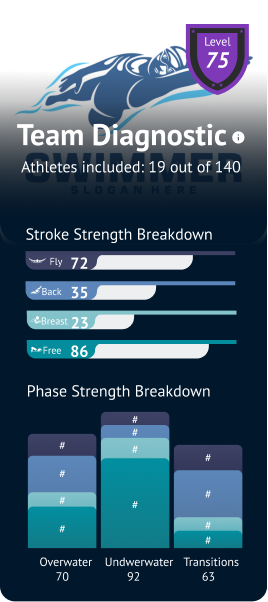
Level badge
This indicates how your team stacks up against all other teams in our database. This is not a rank number, it is percentage-based like all of our scores, with a scale from 1 - 100.
Stroke Strength Breakdown
Similar to level badges, stroke strengths show how your team compares to all others in our database for each of the 4 main stroke types (Fly, Back, Breast and Free). Just like Focus 75 is the middle, anything above 75 your team is stronger than the average, and below it's an area ripe for improving.
Phase Strength Breakdown
Just like Stroke breakdown, this shows where your team stands for each stroke type, by the 3 swim phases. Quickly identify which area for each stroke type is help your team improve faster.
Top Strengths and Weaknesses
This section includes your best and worst metric for each stroke type and swim phase. Quickly identify where your team will benefit most from specific technique work. Each metric has a faint white line at 75, so you can see where typical is across all metrics. Pick metrics that are furthest from the 75 mark, and focus on those to produce faster swimming.

All Metrics Changes
In this section you will find all of the focus metrics, separated by Input Vs Output to make it easy for you to pick the right metrics to work on.
Each metric card will show you the team score for each stroke type, as well as how much that metric has changed in the last 28 days. These scores centre on 75 just like all our scores, so you can quickly identify the specific metric that will help your team improve the fastest.
How to pick where to focus: Look for metrics that are red across all or most of the stroke types. Try to pick input metrics to work on, then keep an eye on how output metrics are impacted.
What to pay attention for: if you are focusing on a specific metric, monitor complimentary metrics for negative % change. For example, if you're working on stroke rate, keep an eye on DPS and speed overwater to make sure you are not trading too much.
