
Your main Intensity Score summarizes how hard a workout is. To see how Intensity has varied over the past 1, 4 or 12 months look at the Intensity over time graph located at the bottom of the Intensity page for any workout.
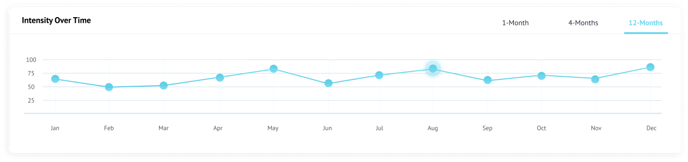
You can see how your overall workout Intensities vary day to day and at different points during the season. You generally want to see a lot of variety week to week, as this indicates training is targeting different energy systems. The Higher the score, the harder that workout was. Workouts break out by type as the scores change:
| Workout Type (purpose) | Triton Score Range |
| Recovery | < 61 |
| Moderate | 61 - 70 |
| Vigorous | 71 - 80 |
| Hard | 81 - 94 |
| Max Effort | 95 - 100 |
Intensity should reflect your training plan. In a build-up period, volume and/or speed will increase, in combination with rest reduction. During taper, the opposite trend will come through.