
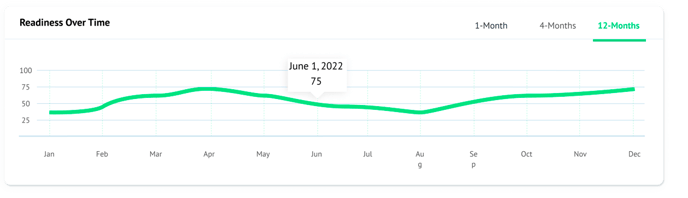
The main Readiness Score summarizes how well an athlete is managing load changes week to week. To see how Readiness has varied over a longer period of time, look at the Readiness Over Time graph, which is at the bottom of the Readiness page for any workout.
The ideal state would be to see Readiness consistently above a 90. If there are periods in the season where athletes are below a 90, there are a few things to look at:
- Look at athlete attendance vs the plan. If they are only swimming some workouts or only some of all workouts, their loading will not match the plan and is likely to be outside of ideal.
- If there are several athletes with similar over-time graphs, look at how volume and intensity changes are being planned. The plan may need to be adjusted to reduce the fluctuation from week to week.
- If a swimmer is consistently at practice but still finding their readiness all over the map, which is not consistent across many swimmers in the squad, look for internal stressors. Try to find trends in timing seasonally where things get out of control. For instance, do they tend to over or under-train during high-stress weeks at school or close to holidays? Any pattern you can pick up on will help you adjust training to keep them in the safe zone in the future.
Remember: for the most accurate Readiness Score and advice, it is important to enter Workout Ratings after every activity and enter every activity into TritonWear.