
Focus includes most (but not all) metrics offered by TritonWear. To learn more about all TritonWear metrics, including which are part of Focus, check out this helpful article.
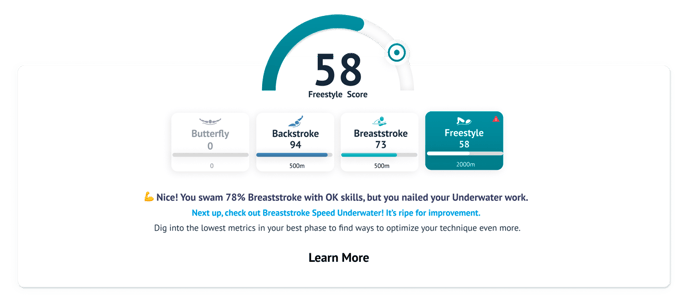
Stroke Type Score
You will get different scores for each metric and phase, depending on the Stroke type you are viewing. By selecting a stroke at the top of the page, you will change which metrics are displayed. The colour of your on-track metrics cards will reflect the stroke colour of the selected stroke.
Comparison Options
By selecting Compare to "My Average" you will see your metric scores relative to yourself. It will be a good way to identify if you performed well in a specific skill in your latest practice. Remember, your average performance TritonWear uses as a baseline will evolve and progress over time.
By selecting Compare to swimmers "Like Me," you will see your metric scores relative to your peers, which will be very useful for identifying strengths and weaknesses. This view is already comparing you to swimmers with a similar profile to yourself, so as you improve your comparison group will change. You shouldn't see much movement week to week, but over longer periods of time, you'll see a difference.

Phase Scores
Each metric falls under one of the three phases, as follows:

Each phase gets a score that will help you zero in on which function of your swimming needs the most attention. If your "Like Me" phase score for under-water is below 75 for example, this means you are behind your comparison group, and improving in this phase will help you catch the competition.
Metric Scores
Each Focus metric gets a score and when the card is flipped shows a Today, Average, and Like Me value. All of these differ greatly from the metrics values in activity details:
- A metric score in Focus is a value assigned to a metric after it's been analyzed against an athlete's evolving profile to determine if it was executed well (>74) or poorly (<65)
- A metric value in Focus is the average metric result across the entire workout for core swimming (analyzed laps after removing outliers)
- A metric value found in activity details is a lap, rep, or set average plotted on the graphs and displayed as favourite metrics in activity details

Focus Metric Scores are relative numbers, because they are comparisons that show different scores depending on the Compare option selected. Comparisons to "My Average," provides scores relative to your own average performances in that metric. Comparisons to swimmers "Like Me," offers scores relative to an aggregation of other swimmers of the same competing gender and a similar height and speed range).
Make sure you pay attention to which Compare option you have selected as these tell you very different things.
Helpful Hints
Whether you are looking at "My Average" or "Like Me" scores, there are a few key elements to highlight
- Scores lower than 65 will be highlighted red, no matter which side of the card is in view, or which compare option is selected, to make it easier to pick out metrics to explore
- The progress statement changes with the metric selected and based on the compare option selected to make it easier for you to pick out metrics to focus on
- The progress graph changes with the metric selected and only displays data points from workouts of the same pool length. It displays only the today value for each day plotted, so you can easily see if a skill is being acquired or hitting peaks and regressing
